
How You Can Boost Your Biopharma Commercial Profitability
By Ric Cavieres, principal in the Life Science Advisory Practice, EY
“What is our commercial profitability?”
That’s a question biopharma executives have long struggled with due to an inability to analyze the true cost of drug commercialization.
 The issue of commercial profitability has been further complicated by an evolving healthcare landscape that includes an increased focus on costs and the shift in decision-making power toward payors, an increase in discounts (via rebates, co-pay cards, patient assistant programs), multichannel marketing, and new organized customer models such as integrated delivery networks (IDNs) and accountable care organizations (ACOs).
Fortunately for biopharma, the increasing complexity of commercial spend is paralleled by an increasing availability of data. The companies that can successfully leverage this data via advanced analytics will gain a competitive edge and increase their commercial profitability. Considering a 1 percent increase in commercial profitability equates to nearly $400 million for a top 10 biopharma, companies are jumping on board to incorporate commercial profitability into their business to significantly boost their bottom lines.
WHAT IS COMMERCIAL PROFITABILITY?
Biopharma struggles with assessing true commercial profitability because the industry typically lacks a holistic view of its commercial spend. For instance, various types of commercial spend (including payor rebate, wholesaler discounts, patient co-pays, physician samples, marketing spend, etc.) are only being tracked within the siloed business functions of sales, marketing, and market access.
Market access typically measures performance with the gross-to-net (GTN) metric and only takes into account discounts to payors, wholesalers, pharmacies, and institutions such as long-term care (LTC) and hospitals. This methodology accounts for rebates and chargebacks but misses additional discounts given as patient co-pay discounts, which is typically owned by the brand and patient assistance programs (PAPs). The brand and sales teams typically focus on market-share metrics, total prescriptions (TRx), and new prescriptions (NRx), but these metrics do not account for the discounts or the commercial OPEX spend to drive these sales and market share. True commercial profitability must take into account all commercial discounts and spend:
GROSS SALES DISCOUNTS & COMMERCIAL OPEX SPEND
COMMERCIAL PROFITABILITY
DISCOUNTS = rebates, chargebacks, admin and other fees, patient co-pays, and PAPs
COMMERCIAL OPEX SPEND = sales force spend, including samples, marketing, and brand spend, including DTC (direct to consumer) campaigns; all multichannel and speaker programs; and sales, marketing, and market-access people spend.
Failure to look at commercial profitability holistically presents specific challenges to optimizing spend, ultimately resulting in the potential for both overspending and suboptimal sales.
BENCHMARKING, CURRENT COMMERCIAL PROFITABILITY, & FUTURE STATE OPTIMIZATION
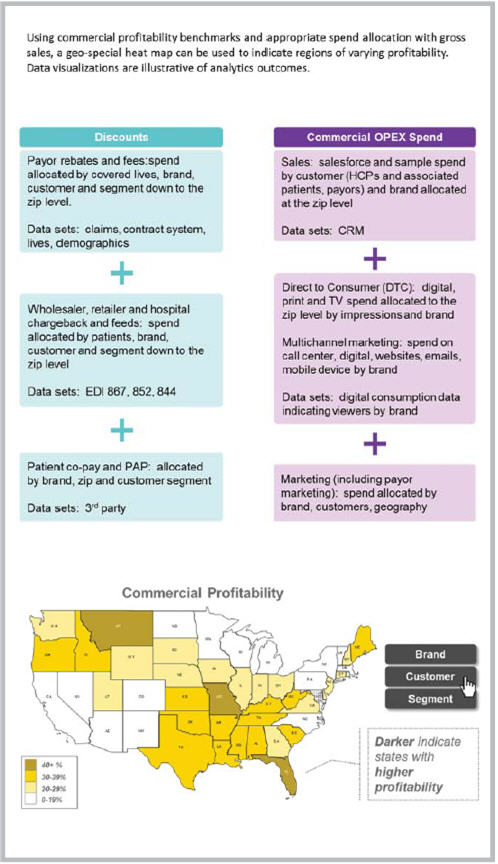
The key to effectively leveraging your disparate data sources lies in defining and standardizing spend and allocating it at the same level of gross sales so that commercial profitability can be measured at the granularity of geographic zip code, customer, brand, and segment (Figure 1).
Once commercial profitability has been measured and benchmarked, the next step is to determine how to optimize both spend and commercial profitability. Innovative commercial optimization models have been developed to help biopharma companies gain insight into opportunities for reducing wasteful spend and investing in revenue-generating efforts. These analytics models use algorithms that correlate and weigh the input levers (various types of spend allocated at appropriate levels) and the desired outputs (commercial profitability, sales revenue, market share, patient access) while accounting for the market factors (e.g., demographics, payor positioning, and brand saturation) impacting the correlation. In effect, this approach to determine optimal, future commercial profitability is driven by Big Data and focused on advanced analytics.
These insights are of tremendous value to brand teams as they budget future spend across multiple marketing channels and customer types, as well as for the field sales force budgeting and deployment. These same insights also drive the decisions regarding brand targeting to customers and market-access optimization through customer discounts. Taken together, these insights introduce a holistic commercial spend allocation optimally aligned to drive a predetermined commercial profitability target.
To more clearly illustrate the real-life value driven by these analytics, consider that the top 20 biopharmas spend, on average, 28 percent of their gross revenue on discounts and 30 percent of net revenue on SG&A (selling, general, and administrative) costs. On average, 49.5 percent of gross revenue is spent on commercialization, or almost 50 cents on every dollar. Optimizing this by just one commercial profitability point will drive $400 million per annum. A few examples of where that $400 million would come from:
- MULTICHANNEL
Based on average pharma sales force size and spend per rep, EY estimates that $60 million in profitability can be gained by allocating promotional spend to more appropriate customer channels; we have seen up to 10 percent savings resulting from optimization of multichannel investment dollars. - CAMPAIGN EFFICACY
The top 10 biopharma companies spend close to $98 billion on overall sales force promotion and advertising, with $3 billion spent on direct marketing to consumers and $24 billion on direct marketing to healthcare professionals. Given the increasing challenge for sales reps to reach physicians (a Medical Marketing and Media industry survey indicates 23 percent of physicians refuse to see reps), EY estimates the industry could experience savings of $1.5 billion by reducing face-to-face detailing spend by just 10 percent. With greater insight into cost-savings opportunities, biopharma can greatly increase its commercial profitability not only through cutting unproductive costs, but reallocating these costs into campaigns that are anticipated to increase sales. - PATIENT CO-PAY
One pharma company discovered that by optimizing patient out-of-pocket spend (through co-pay programs), it could increase gross sales over $100 million by focusing on less than a dozen geographic regions that were underperforming.
UNITING THE CFO AND COMMERCIAL OFFICES
With the insights generated from predictive models, commercial and finance teams can collaborate more effectively and generate granular budgets to drive targeted commercial spend. These insights also tell commercial leaders how to allocate their budgets into geographies as well as help those leaders create action plans for their sales forces. This includes field sales force alignment and investment, marketing and multichannel channel allocation, DTC campaigning, and discounting and contracting strategies. Brand leads will see where they have opportunities to optimize and can leverage these insights to support requests for additional budget as needed. On the finance side, there is increased visibility into where budgets are being spent, with more detail around anticipated ROI of various commercial spend channels. With these insights, the finance office will have better data to support its spending decisions across the organization and be able to more accurately forecast the anticipated resulting revenue and profitability. The resulting process unites the CFO office and the commercial business through the enablement of the common metric of commercial profitability and understanding of business levers that drive such profitability. Together they can work toward the goal of driving the next 1 percent of commercial profitability.