
Assessing The Discovery Outsourced Services Market
By Stella Stergiopoulos, Michael Wilkinson, Josephine Awatin, and Ken Getz
In 2012, the Tufts Center for the Study of Drug Development (Tufts CSDD) estimated that the total market for outsourced R&D services in the United States ranged from $32.9 billion to $39.5 billion, with the two most mature markets; chemistry, manufacturing, and controls (CMC) and clinical research; accounting for 44 percent of the total. Applied research (i.e., discovery) and nonclinical research — more nascent outsourcing markets — accounted for 32 percent of the total market.
Traditionally, market analysts have focused on CMC and clinical research services outsourcing due to the relatively high number of publicly held companies operating within these sectors. Estimating the size of the contract services market for drug discovery activities has been more challenging. The high proportion of small, privately held companies as well as differences in market definitions and modeling approaches have created inconsistencies and variations in market size estimates. Some market size reports focus only on services provided by CROs, while others include the technologies required for assays.
Another possible explanation for these differences in market size estimates is that market analysts have focused predominantly on the most mature activities (i.e., regularly outsourced activities such as drug toxicity assays and high-throughput screening [HTS]). More nascent services, such as assays specific to ion channels and transporters (ICT), may not be included in all market estimates, even though these niche areas have seen growth in the last few years (e.g., Lilly’s joint venture with RaQualia Pharma, CRL’s acquisition of Biofocus and Chantest, Pfizer’s spin-off of Icagen).
As the demand for outsourcing across the entire drug development value chain continues to increase, more precise estimates of emerging areas, such as outsourcing ICT research in discovery, are required. These more accurate metrics will aid sponsor companies in strategic planning and resource planning.
STUDY METHODOLOGY
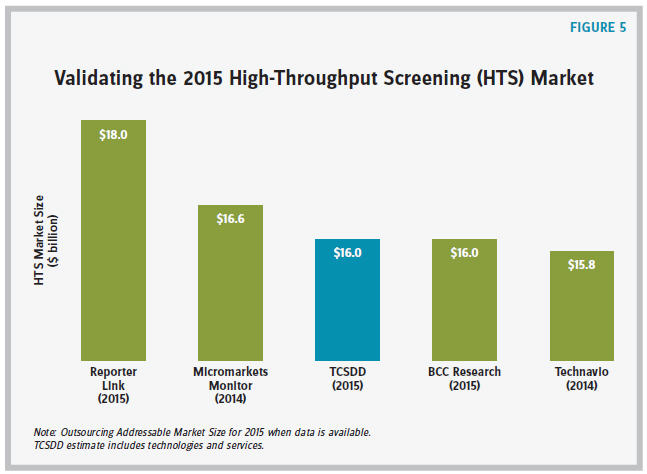
In early 2015, Tufts CSDD estimated the overall market for contract discovery services, as well as the discovery technologies market, i.e., companies that provide technologies to biopharmaceutical companies. Tufts CSDD used a bottom-up approach to assess the markets for discovery activities, HTS services, and, lastly, key services within discovery such as ICT research services. The new study used the same methodology as the 2012 study but with emphasis on a more granular assessment of the discovery services market.
Tufts CSDD created a detailed definition of discovery services and technologies and then compiled a comprehensive list of service providers offering these services and technologies.
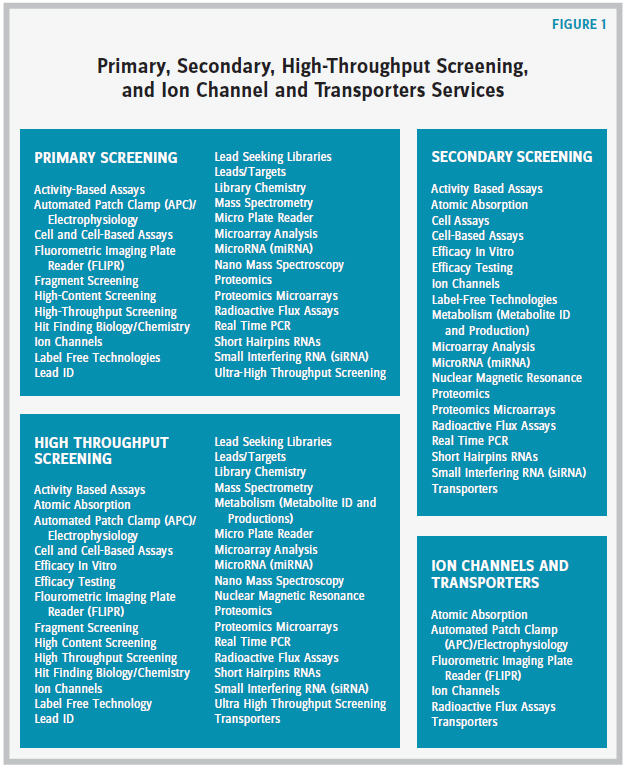
Services for HTS, primary screening, secondary screening, and ICT were also analyzed. Data was gathered on a total of 910 companies. Companies were included in the analysis if they had an active website during the study (conducted from March 2015 to November 2015). Tufts CSDD used proprietary databases, Standard and Poor’s Capital IQ, and Pharmatching.com to identify companies operating within the discovery services market, specific services provided, and key company characteristics (e.g., company age, if publicly traded, revenue, profits, employee count). Companies were organized using the following definitions:
- Companies with 1-5 technologies, 1st quartile
- Companies with 6-8 technologies, 2nd quartile
- Companies with 9-12 technologies, 3rd quartile
- Companies with more than 12 technologies, 4th quartile
In instances when profit, revenue, and head count values were available, Tufts CSDD evenly distributed them across all the services and technologies offered by the company. Segment revenue was used for publicly held companies when possible. Once data was gathered, total discovery services and technologies market sizes were estimated, along with key financial indicators, to assess the maturity of these services and technologies.
STUDY RESULTS
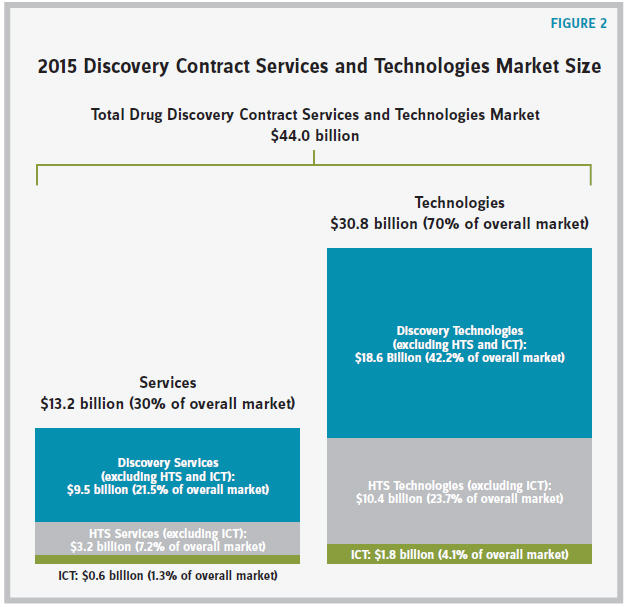
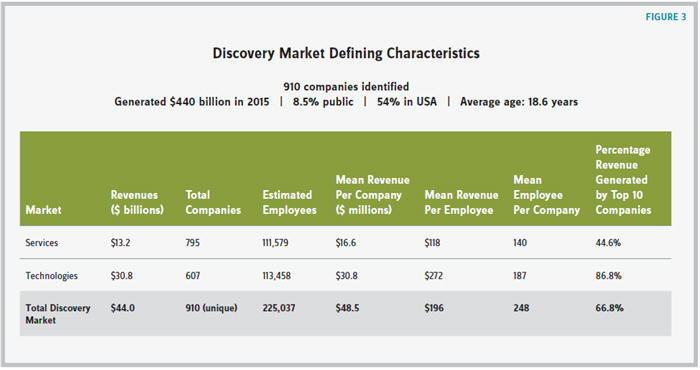
In total, 910 companies offering discovery services or technologies were identified. These companies generated $44 billion in discovery services and technologies in 2015. Discovery technologies generated approximately $30.8 billion, while discovery services generated approximately $13.2 billion.
Of the 910 companies identified, 795 of them provided discovery services, while 607 of them provided key technologies necessary for discovery research (some companies provide both technologies and services).
The majority of discovery technologies and services companies are privately held; only 8.5 percent are publicly traded. The majority (54 percent) also have headquarters that are located in the United States. The following are some key differentiators between discovery services and technologies:
Discovery Technologies Companies
- ICT technology accounts for approximately 4 percent of the discovery technologies market, with HTS technology accounting for slightly over 23 percent. The rest of the discovery technologies market is made up of other technologies.
- Discovery technology companies employ 47 more individuals, on average, than discovery services companies.
- The discovery technologies market is saturated, with 86.8 percent of revenue coming from the top 10 revenue-generating companies.
Discovery Services Companies
- ICT research accounts for approximately 1 percent of the discovery services market, with the rest of HTS services accounting for approximately 7 percent. The remainder of the discovery services market is made up of other services.
- The discovery services market is nascent, with 44.6 percent of revenue generated coming from the top 10 revenue-generating companies.
The HTS market (combining services and technologies) has similar trends, with approximately 9 percent of companies being publicly held and 55 percent of companies having headquarters in the United States. Of the 910 companies identified, 629 either provide HTS services or technologies or reagents necessary for HTS.
- The average age of these companies is 18.9 years.
- The typical HTS services and technologies company generates $25.4 million and employs 120 individuals (as compared with the average 248 employees at discovery services and technologies companies).
- The HTS market is saturated, with 73.2 percent of revenue being generated by the top 10 companies.
- Of the 910 companies identified, 538 provide HTS services specifically, generating a total of $3.8 billion (including ICT). These service-specific companies generate, on average, $7 million per company and employ 57 individuals.
Focusing on select HTS technologies and services combined, ICT services and technologies generated the largest revenue followed by the broad category of cellbased assays. In contrast, more companies (244) provide cell-based assay services and technologies as compared with ICT research services (54) and ICT research services or technologies (61). Those companies that provide cell-based assay services employ an average of 26 individuals and generate $3.4 million per company.
Within ICT there were a number of mature segments: only six companies were identified as providing radioactive flux solutions (services and technologies), with all of these companies being publicly held. Companies providing radioactive flux solutions are also the oldest, on average 40.5 years old, followed by companies providing fluorescence-based ion flux assays (Fluorescence Imaging Plate Reader) services and technologies (on average 30.5 years old). Companies providing radioactive flux solutions generated $470 million in revenue, and companies providing automated patch clamp services and technologies generated $409 million in revenue.
DIFFERENCES FROM THE 2012 STUDY
This follow-on study to the Tufts CSDD 2012 initial outsourcing market size focuses specifically on discovery services and technologies.
Overall, the discovery services market is not as mature as the discovery technologies market. Additionally, the services market is more fragmented, with more companies offering services, and the top 10 companies accounting for nearly 50 percent of the revenue generated (as compared with discovery technologies, where the top 10 companies account for close to 90 percent).
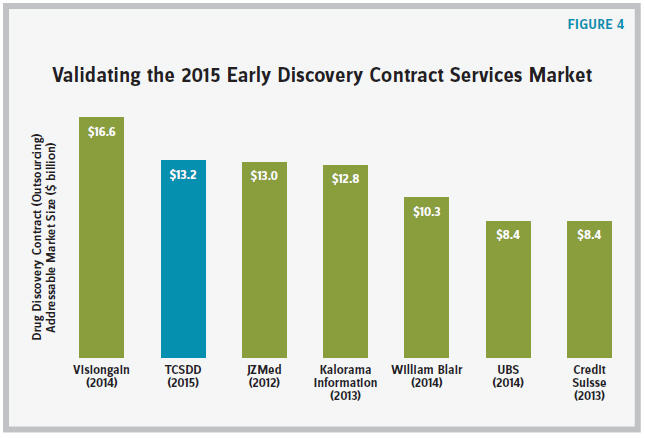
These estimates are higher than the initial 2012 Tufts CSDD report due to differences in methodology. The initial 2012 report focused exclusively on key geographic biopharmaceutical hubs in the United States, and measured productivity of each facility located in those hubs. Moreover, this analysis included companies that offer discovery technologies, whereas the 2012 analysis did not include these companies. Although the imputation methods between the two studies are consistent, the inclusion of high-revenue-generating technologies companies has likely increased the median revenue applied to companies with no revenue information.
STUDY LIMITATIONS
There are a number of limitations to this study that should be noted. Tufts CSDD relied on data from Standard & Poor’s Capital IQ database to assess the financial health of privately held companies. This data is gathered using qualitative methods that may understate and overstate actual financials. Additionally, using imputed data to estimate revenue specific to a service or technology may be biased, as the smallest company’s revenue may be inflated and the largest company’s revenue and employee size may be deflated. Although Tufts CSDD applied a methodology that used companies of similar size with actual revenue and employee counts to impute this data for privately held companies, this bias may exist.
Future Tufts CSDD research will focus on key discovery services, looking to understand in more detail best practices for sourcing research related to ion channel and transporters due to the increase in merger and acquisition activity specific to this service. In addition, Tufts CSDD plans to analyze the data by geography to assess the economic impact of these services and technologies locally.
With rising drug costs and more pressure from regulators to provide transparency on drug pricing algorithms, the use of CROs to streamline development costs will continue to grow. It is hoped that the results of this study will provide estimates for the discovery outsourcing market and aid biopharmaceutical companies in their strategic planning and sourcing decisions.
Stella Stergiopoulos is senior project manager at Tufts CSDD. Michael Wilkinson and Josephine Awatin are both research analysts at Tufts CSDD. Ken Getz is associate professor and director of sponsored research programs at Tufts CSDD.
The authors would like to thank Richie Cunningham, CEO and president, Icagen; Douglas Krafte, CSO, Icagen; and Krista Steger, president and cofounder, Forge 4ward, for their contributions to this manuscript. This study was sponsored with an unrestricted grant from Icagen (formerly XRPro Sciences).